← Changelog
v0.30.0September 25, 2026
Prometheus Metrics for Pods & PVCs
This release brings live Prometheus-backed metrics into the app, alongside a Karpenter integration for autoscaled clusters.
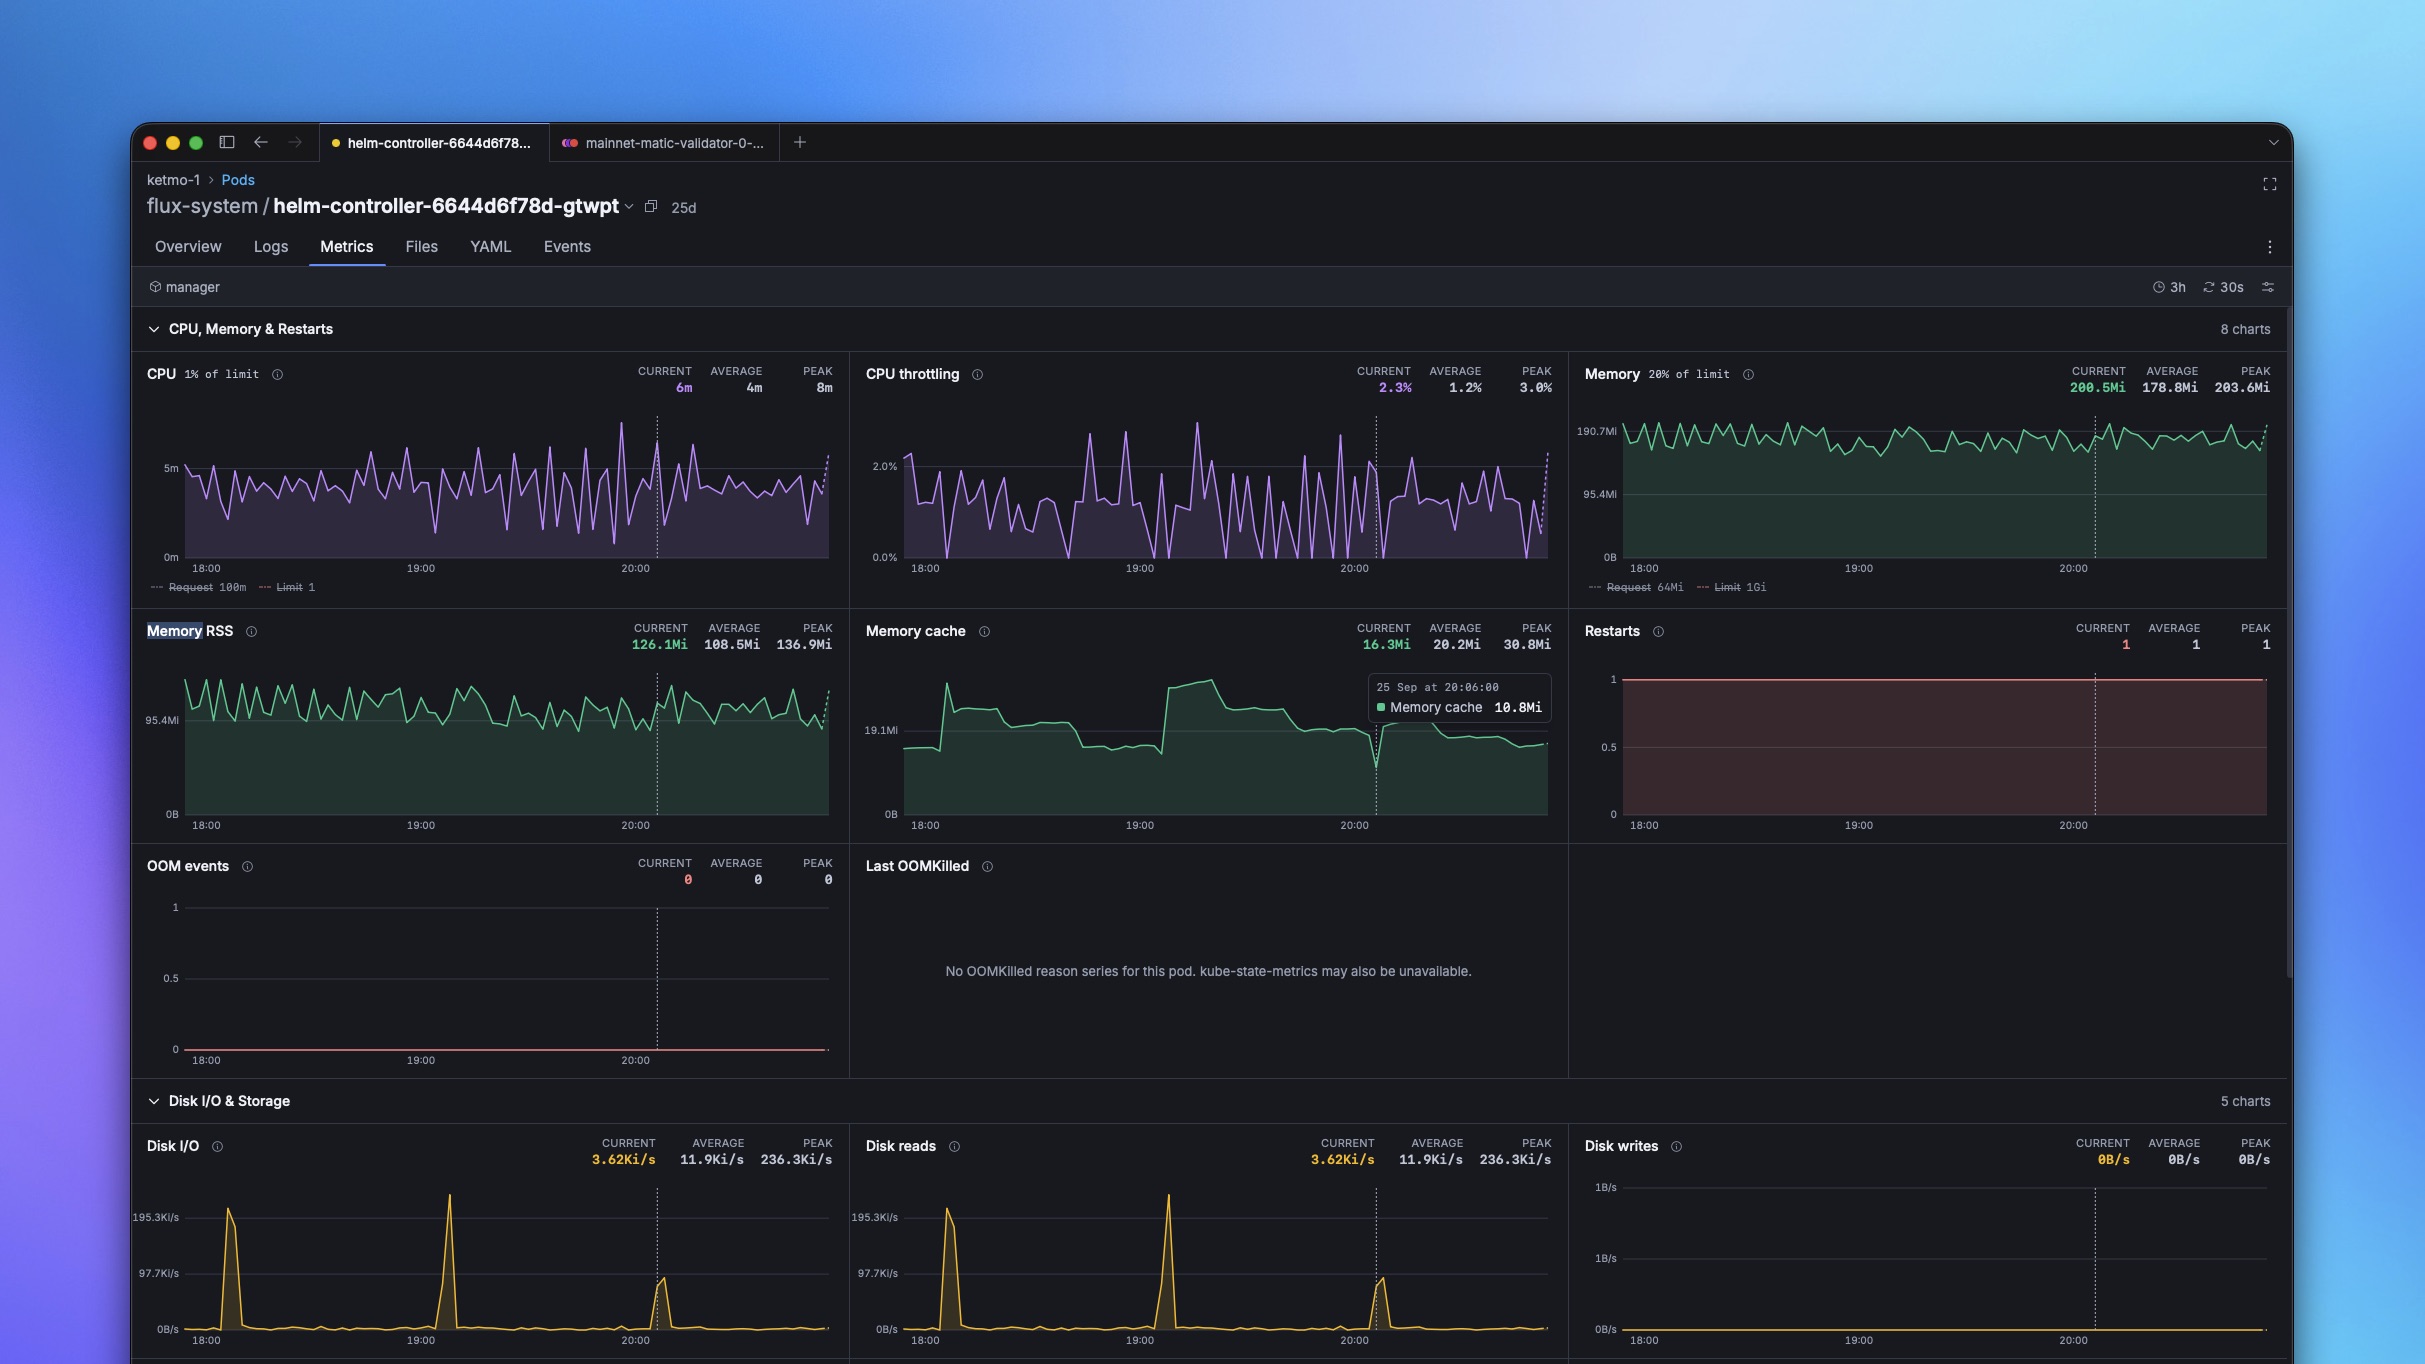
📈 Prometheus Metrics
- A new Metrics tab on Pods charts CPU, memory, network, and filesystem usage per container, sourced directly from Prometheus.
- PersistentVolumeClaims get a Metrics tab too, with kubelet volume stats (capacity, usage, inodes) and, for Carina volumes, custom Volume I/O metrics.
- Auto-discovery finds Prometheus in your cluster, or you can configure it manually from Settings → Monitoring, with per-context layering and a connection test.
- An option to hide unavailable metrics keeps the tab focused on panels that actually have data.
🚀 Karpenter
- NodePool, NodeClaim, and NodeClass list and overview pages, with capacity, disruption, and requirement details.
- Block/Allow Disruption toggle on NodeClaims, and relations linking NodePools, NodeClaims, Nodes, and NodeClasses.
- Pods, CPU, and Memory Allocation columns added to Nodes and NodeClaims.
✨ Other Improvements
- The Restarts column now folds in the last restart's exit code, colour-matched between the badge and the reason, with screen-reader support.
🐛 Fixes
- List copy actions now route through the Wails clipboard instead of the browser one.
🧹 Misc / Chore
- Bumped frontend and Go dependencies, and pinned
kube-openapito the version Kubernetes 0.37.1 expects.