← Changelog
v0.31.0October 6, 2026
OpenCost Kubernetes Cost Monitoring
This release brings a first look at Kubernetes cost monitoring, built on OpenCost's Prometheus metrics. It ships as an opt-in feature preview.
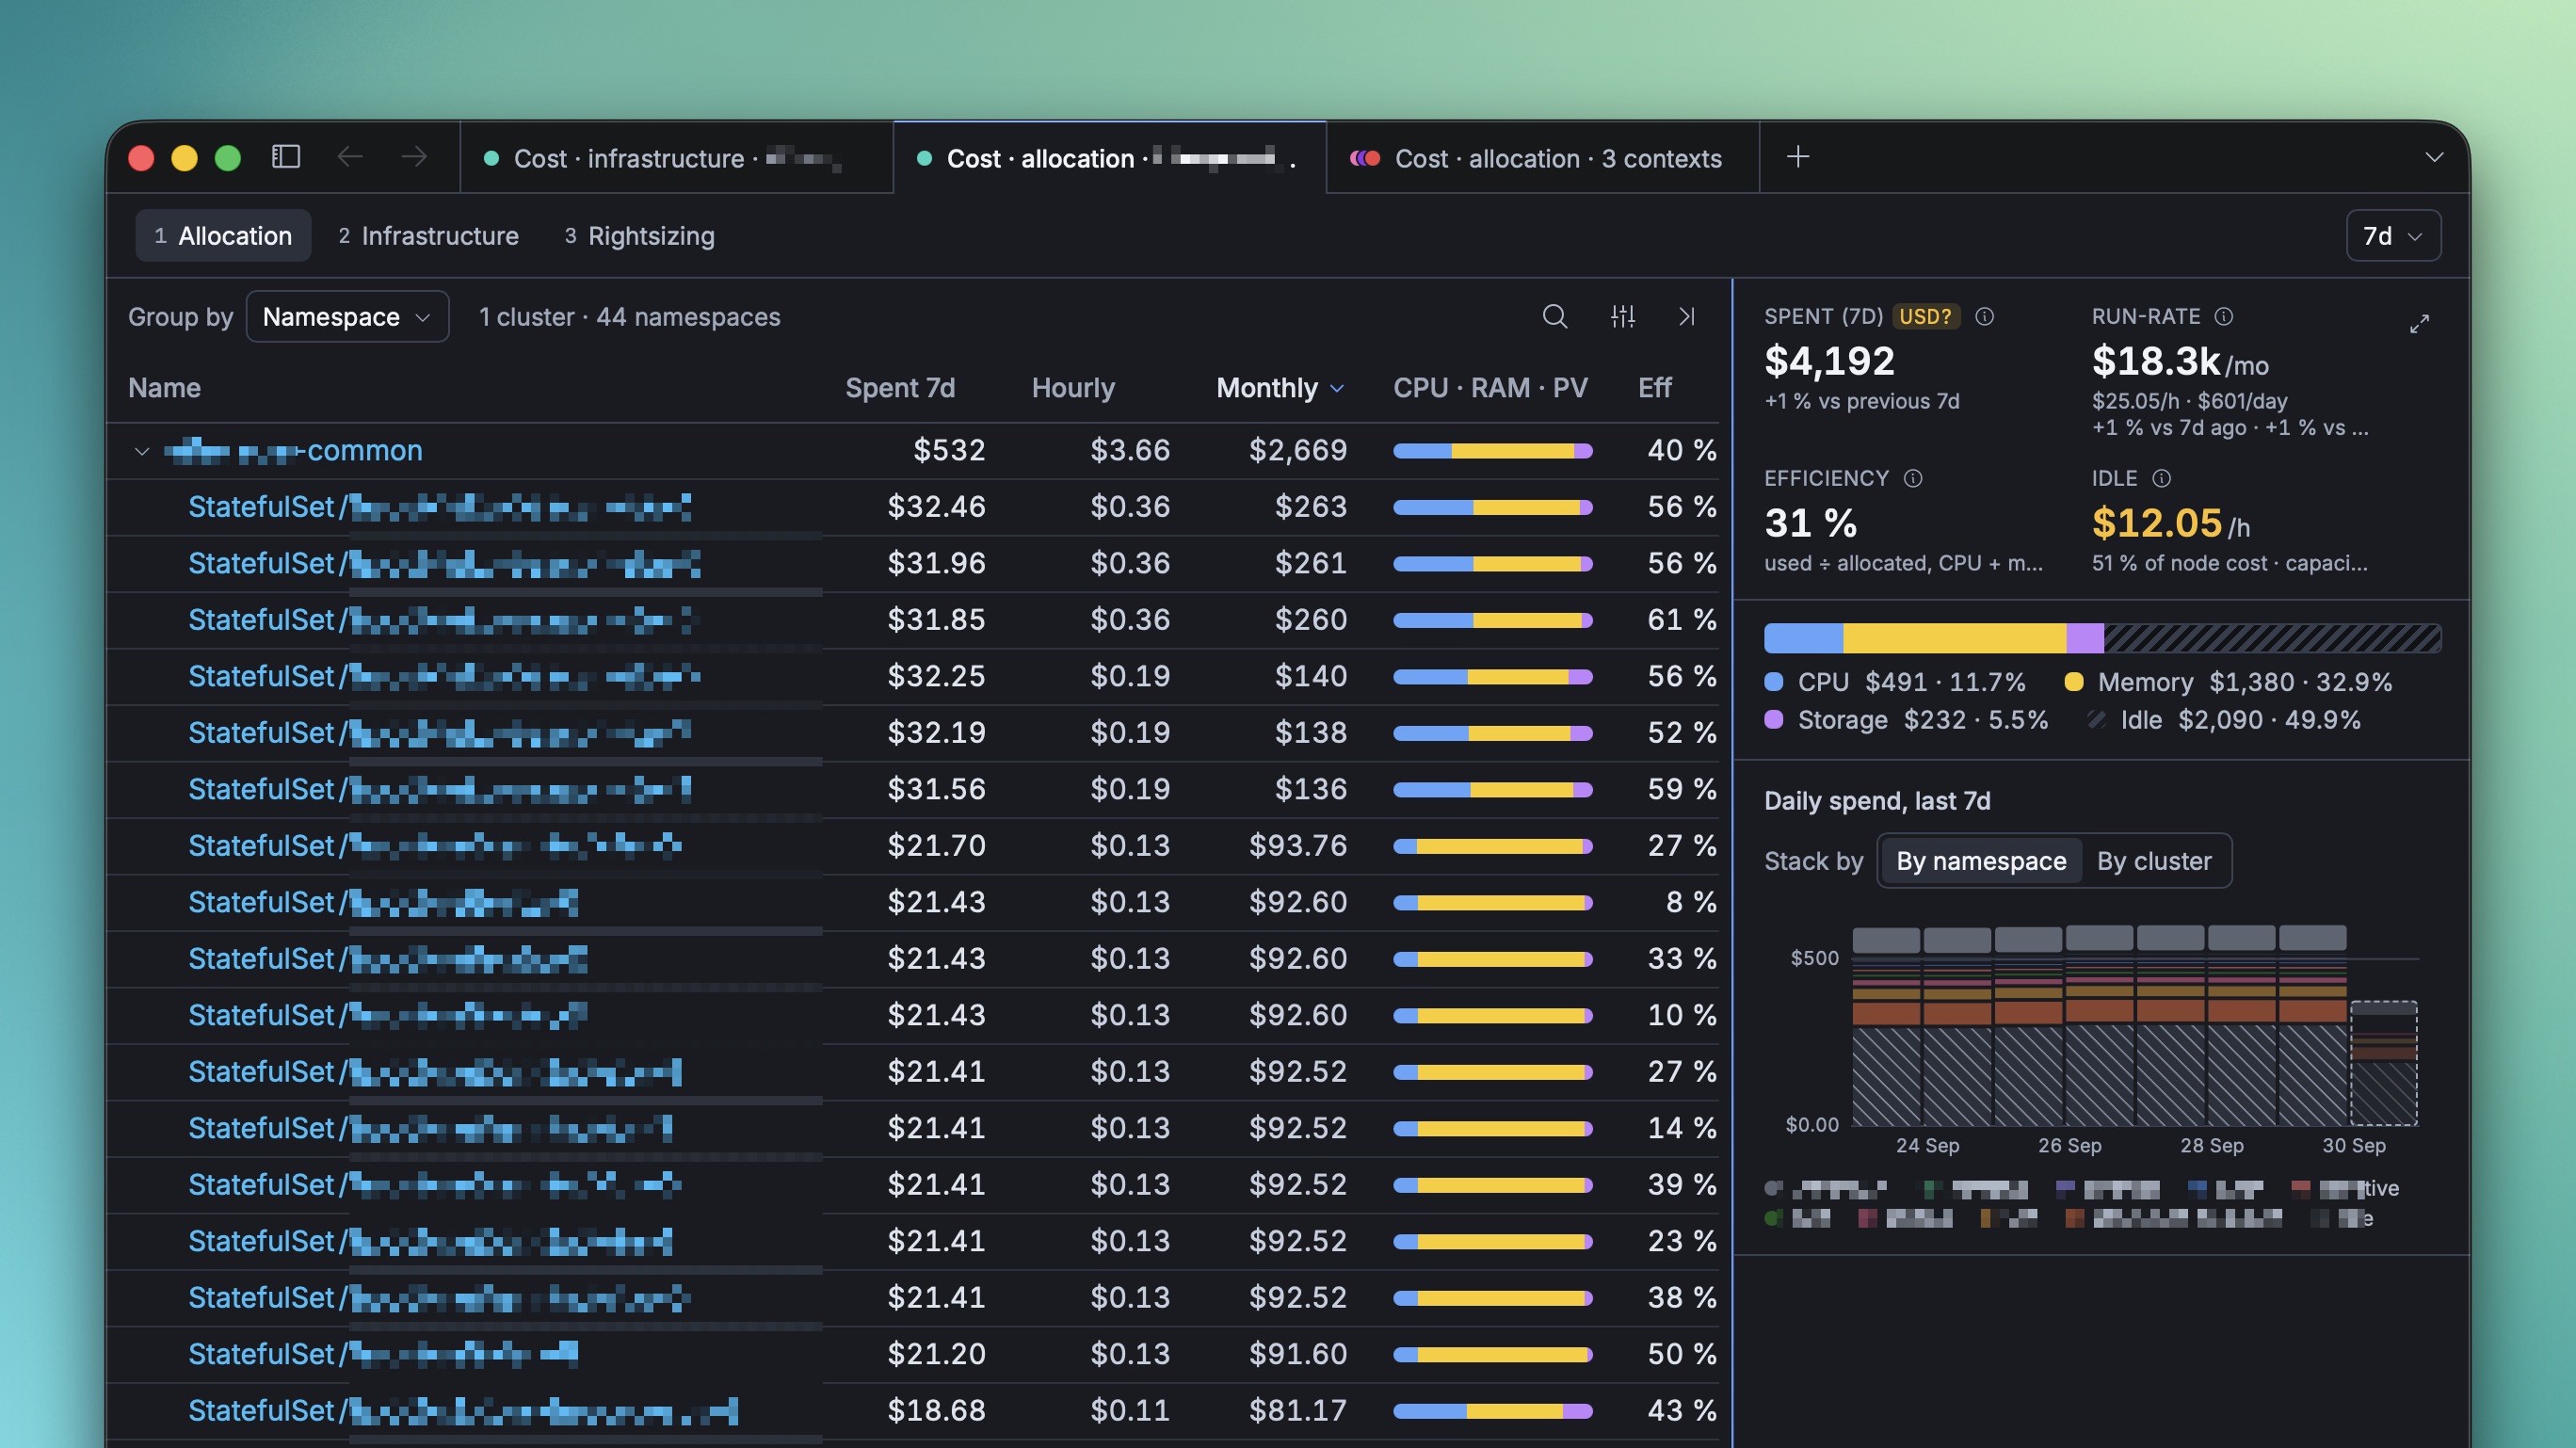
💰 Cost (Feature Preview)
- A new Feature Previews section in Settings lets you try features that work but are still taking shape. Cost is off by default: turn it on there to see it.
- A Cost overview page with an Allocation tab showing spend, run-rate per month and per hour, a CPU · RAM · PV split, and a daily spend chart, followed by an allocation table you can group by namespace, workload, label, Helm release, Flux or Argo, over a 24h, 7d or 30d window.
- The Infrastructure tab breaks spend down into nodes (with idle cost per node and cloud console links), instance types, volumes, load balancers and the management fee, and compares allocated against billed spend.
- The Rightsizing tab scans a week of usage and recommends container requests for each workload. Each recommendation shows its estimated savings, a confidence level and the evidence behind it, including the queries it ran. Apply writes the new requests in one patch after a confirmation dialog (opt-in from Settings › Monitoring › Cost). When Flux or Argo manages the workload, you get Copy patch instead.
- A Cost tab on resource pages, covering namespaces, Deployments, StatefulSets, DaemonSets, Jobs, CronJobs, Pods, Nodes, PersistentVolumeClaims and PersistentVolumes, plus a cost card on the Cluster overview.
- Change against the previous window on every header and row, plus the run-rate compared with 7 and 30 days ago.
- Multi-cluster aware: each cluster's idle cost appears beside the pooled total, and a coverage line shows which selected clusters report cost data.
- Currency is detected or set per context from Settings › Monitoring › Cost.
- Keyboard-driven: the Cost page and its tabs have their own shortcuts and command palette entries, and F toggles a full-width side panel.
- Fast on large clusters: range queries are read in fixed day cells and cached for the session, so a refresh only re-reads the current one.
✨ Other Improvements
- Chart colours are consistent across the app: CPU in blue, memory in yellow, storage in purple.
- The sidebar namespace selector is greyed out on pages that ignore it.
🧹 Misc / Chore
- Bumped frontend and Go dependencies.